Tuesday, 30 September 2014

Pay attention to research and dusty old theories

HBR post by Robert Litan (link)

A really relevant lead piece on the relevance of initial research and theorisation. But Robert's main point is that even the most modern enterprises have something to learn from the academics.
Auctions. Consider first the increasing use of auctions, which have a distinguished history in the development of economics. In the 1900s, French mathematician-economist Leon Walras envisioned prices in a market economy being set by an auctioneer (since known as the “Walrasian auctioneer”) conducting continuous auctions for all kinds of commodities.
It may be tempting to think that the Walrasian auction is just a theoretical construct, useful primarily in a classroom setting for thinking about markets, and in the real world, only for scarce commodities or unique items, of the kind put up for sale by Sotheby’s or Christies. But that would be a mistake.
The late Julian Simon (better known, perhaps, for his optimistic views about population growth and resource abundance) thought up the idea for having airlines auction off overbooked seats and persuaded the Civil Aeronautics Board, which used to regulate airlines fares and entry, to permit the idea in the 1970s. Economist Ronald Coase proposed auctioning off segments of the electromagnetic spectrum in late 1950s, a policy idea that was later adopted in the 1990s. Many economists since have been hired by the U.S. and other governments to help them design these often complicated auctions and by telecommunications companies trying to figure out the best strategies for bidding.
Two well-known companies have also made auctions famous, and economists have played central roles in the success of each. Google generates most of its revenue through an auction-based system of selling ads that was developed by two engineers but validated by its chief economist, Hal Varian, a former consultant to the company who was also the first Dean of the School of Information Sciences at the University of California at Berkeley. Varian has since overseen the hiring of a large corps of statisticians and economists who developed other innovations for the company, notably Google Trends, which can be used to track the number of search terms that can be helpful in predicting various real world events (such as the progress of the flu or forthcoming official unemployment statistics).

Friday, 25 July 2014

And my version of the exercises spreadsheet is in the same shared area...

In the shared folder (link).

Exercise: Network with Diminishing Returns

Goal To model/graph demand characteristics for a network market with diminishing returns or a saturation effect.
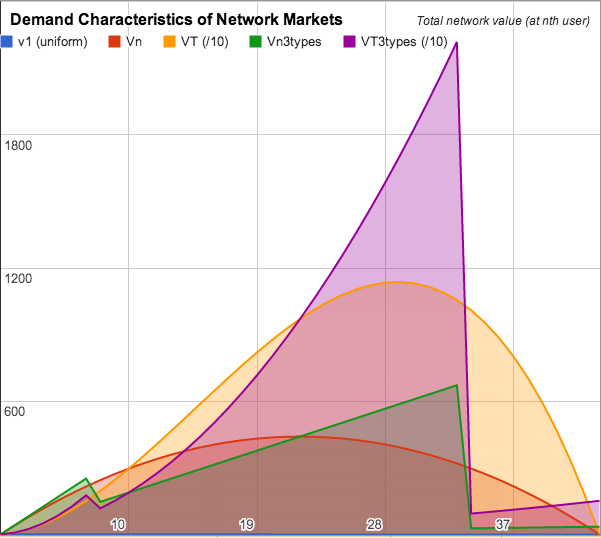
Consider a network market of expected size N (e.g. users anticipate up to 50 people in a market for some good), where each user's intrinsic propensity to purchase is a value v uniformly distributed over the unit interval, i.e. v: [0, 1]. In this case we will model a network market where the actual value obtained by the nth user will be Vn=v*(n-1)*N
Materials
At least one laptop or tablet running a spreadsheet application for each group.
Individuals or groups of 2 or 3 students working on a single computer.
You will need basic knowledge of: spreadsheet calculations, sum, addition, multiplication, bracket rules, cell ranges, relative cell references, absolute cell references etc.

Up to one hour to complete depending on class size, i.e.
20-30" to create models.
10-20" to present and interpret.

Instructions
Open and save a spreadsheet: enter formulae, values and calculations to create a graph representing a network market with positive feedback.

a) Enter the following data in columns and generate line or scatter graphs:
  1. A column containing an index n representing the number of users e.g. from 1 to 50, i.e. up to the Expected Network Size N= 50.
  2. A column containing the individual's reservation value v, i.e. a demand function for each person, uniformly distributed over the interval [0, 1] 
  3. A column containing value of a network of expected size N to the nth user; also the point at which actual network size is also n.  The price or willingness of the nth user to pay i.e. Vn = v*(n-1)*N
  4. A column containing the actual value of the network at size n, i.e. VT = n*Vn, where V= v*(n-1)*N
Your models should look something like this:
Demand/supply curve with uniformly distributed demand (N=43)
b) For the same interval N graph the demand/supply curve for a demand function representing the classic 'three types of customer' model i.e. where v3types: [1.0, 0.5, 0.02]; in the following ratios: Spend Thrifts 10% (v3types = 1.0), Average Spenders 60% (v3types = 0.5), Tight Wads 30% (v3types =.02).
  1. Add a column containing value of a network of expected size N to the nth user; also the point at which actual network size is also n.  The price or willingness of the nth user to pay i.e. Vn3types = v3types*(n-1)*N
  2. Add column containing the actual value of the network at size n, i.e. VT3types = n* Vn3types, where Vn3types = v3types*(n-1)*N
A graph of 'three types of customer' model only:
Network value for 'three types of customer' model


Or combining both uniform distributed demand and the classic 'three types of customer' model:
Graph of network value overlaying uniformly distributed demand and 'three types of customer' model


Exercise: Metcalfe's Law

Goal To model/graph demand characteristics for network markets in order to understand the assumptions and predictions of economics for network industries. In this case Metcalfe's law.
If there are n people in a network, and the value of the network to each of them is proportional to the number of other users, then the total value of the network (to all users) is proportional to n*(n-1) 
(Shapiro & Varian, 1999:p184)
Materials
At least one laptop or tablet running a spreadsheet application for each group.
Individuals or groups of 2 or 3 students working on a single computer.
You will need basic knowledge of: spreadsheet calculations, sum, addition, multiplication, bracket rules, cell ranges, relative cell references, absolute cell references etc.

Up to one hour to complete depending on class size, i.e.
20-30" to create models.
10-20" to present and interpret.

Instructions
Open and save a spreadsheet: enter formulae, values and calculations to create a graph representing a network market valued according to Metcalfe's law.

a) Enter the following data in columns and generate line or scatter graphs:
  1. A column containing an index n representing the number of users e.g. from 1 to 50.
  2. A column containing the valuation if there is no network value to individuals, i.e. if everyone values product equally i.e. v = 1
  3. A column containing a valuation for the whole market but no network effect i.e. Vt = n*v
  4. Next add a column containing a value for the utility/value to nth user of connections to n-1 other users i.e. Vn = v*(n-1)
  5. Finally, add a column containing a valuation for the whole network market (at n) to all n users i.e. Vtn = n*(v*(n-1))
Your graph should look something like this:
Metcalfe's Law for a network up to n=5


Or this for higher n...
Metcalfe's Law for a network up to n=56
Questions:
What do the models represent?
What does the 'index' represent?
How realistic is Metcalfe's law?
Is it possible for the supplier to monetise the value or utility obtained by users?
How should a supplier price the product or service?
Are physical goods industries applicable to Metcalfe's Law?
Is software inherently a network product or service?
What is the key question for a supplier?

Wednesday, 23 July 2014

Exercise: Information and Market Failures

Goal To create a model/graph depicting necessary conditions for a market to exist when quality is uncertain; in order to understand assumptions and different interpretations for all market models.

Materials
At least one laptop or tablet running a spreadsheet application for each group.
Individuals or groups of 2 or 3 students working on a single computer.
You will need basic knowledge of: spreadsheet calculations, sum, addition, multiplication, bracket rules, cell ranges, relative cell references, absolute cell references etc.

Up to one hour to complete depending on class size, i.e.
20-30" to create models.
10-20" to present and interpret.

Instructions
Open and save a spreadsheet: enter formulae, values and calculations to create a graph of the classic price/demand model.

a) Enter the following data in columns and generate line or scatter graphs:
  1. An index, e.g. from 1 to 50.
  2. A variable q representing the quality of used cars, randomly distributed over the interval [0, 1]. You might use the rand() function to generate this value.
  3. Assuming buyers are prepared to pay up to 1.5 times the suppliers reserve price... Add a column 1.5*0.5 = 0.75. Valuation if everyone values equally assuming average quality (1/2) then buyers are prepared to pay a hypothetical average price 1.5*0.5 = 0.75 
Your graph should look something like this:
fig 1. The problem of uncertainty and the market mechanism

b) Add a column for valuation if buyers had perfect quality information and were prepared to pay p = 1.5*q. 

Your new graph should look something like this:
fig 2. If customers had perfect information...
And if you sort the market index on actual quality the graph should look something like this:
fig 3. If a potentially perfect buyer/supplier matching mechanism existed...

Questions:
What do you think the models represent?
What does the 'index' represent?
What changes if you use an index from 1 to 100, 1 to 1,000,000?
Why did use the random number function to generate the quality value?
What is happening if you sort the market index based on actual quality? (other than generate a more appealing graph) Perhaps you are adding something?


Hermeneutics: Discussing ideas as a style of learning

These sessions emphasise discussion as an ideal style of learning. They provide opportunities for you to discuss the underlying ideas and consequences for the theories set out in the papers. Our intent is not to expect you to untangle the minutiae of complex economic models but to encourage you to appreciate the implications and thrust of the ideas and evidence that underpins them and to consider the consequences for policy and behaviour. We therefore expect you to read the book* from cover to cover, and to read (quickly) the research papers and other selected chapters to build up ideas of their intent and implications (see the syllabus).

(*Shapiro, C. & Varian, H. R. (1998) Information rules : a strategic guide to the network economy, Boston, Mass., Harvard Business School Press.) 

Some of the sessions will also be driven with slides in the traditional lecture format. All of the readings, book chapters and books have been very carefully selected. They are paradigm changing exemplars, key contributions to transforming understanding and knowledge of the economic environments that imbricate and constitute aspects of digital goods and markets. Our experience is that the Masters students at UCD really engage with the readings and really involve themselves in good discussions. We expect that you will continue and deepen this tradition.

Exercise: Demand Curves

Goal To create a graph of the classic price/demand model in order to understand assumptions and different interpretations of the model.

Materials
At least one laptop or tablet running a spreadsheet application for each group.
Individuals or groups of 2 or 3 students working on a single computer.
You will need basic knowledge of: spreadsheet calculations, sum, addition, multiplication, bracket rules, cell ranges, relative cell references, absolute cell references etc.

Up to one hour to complete depending on class size, i.e.
20-30" to create models.
10-20" to present and interpret.

Instructions
Open and save a spreadsheet: enter formulae, values and calculations to create a graph of the classic price/demand model.

a) Enter the following data in columns and generate line or scatter graphs:

  1. An index, e.g. from 1 to 50.
  2. A demand function for each person, uniformly distributed over the interval [0, 1] i.e.: 1, 0.98, 0.96, ..., 0.02, 0.0.


b) Add a unit demand function representing the classic 'three types of customer' model i.e. with value/demand/utility [1.0, 0.5, 0.02]; of the following ratios: Spend Thrifts 10% (v=1.0), Average Spenders 60% (v=0.5), Tight Wads 30% (v=.02).

c) Add a demand function representing where 'Everyone Values Equally ', i.e. v=1 for all.

Your models should look something like this:
3 different value/demand/utility models
Questions:
What do you think the models represent?
What does the 'index' represent?
What changes if you use an index from 1 to 100, 1 to 1,000,000?
What if you plotted values using a scatter chart rather than a line chart?
Why use the range 0-1 for utility/demand/value?
What does the idea of demand represent?
What does idea of value represent?
What does the idea of utility represent?
Is it reasonable to use the concepts interchangeably?
What does this model assume about the possible market of consumers or buyers?
Does this model represent actual consumers or buyers? What assumptions about buyers are being made?
Does this model describe both products and services?
Does this model describe both physical and digital goods?
What is a market?
How big is the market? What assumptions are you making?
What is the relationship between market price and demand?
How would you represent the relationship between price and demand? Is it realistic?
What price would the supplier like to set? What assumptions are you making?
What price would you recommend to the supplier to set? Why?
What changes if other suppliers enter the market?

Comments
May use MS Excel, Google docs spreadsheet, OpenOffice, Numbers.