Consider a network market of expected size N (e.g. users anticipate up to 50 people in a market for some good), where each user's intrinsic propensity to purchase is a value v uniformly distributed over the unit interval, i.e. v: [0, 1]. In this case we will model a network market where the actual value obtained by the nth user will be Vn=v*(n-1)*NMaterials
At least one laptop or tablet running a spreadsheet application for each group.
Individuals or groups of 2 or 3 students working on a single computer.
You will need basic knowledge of: spreadsheet calculations, sum, addition, multiplication, bracket rules, cell ranges, relative cell references, absolute cell references etc.
Up to one hour to complete depending on class size, i.e.
20-30" to create models.
10-20" to present and interpret.
Instructions
Open and save a spreadsheet: enter formulae, values and calculations to create a graph representing a network market with positive feedback.
a) Enter the following data in columns and generate line or scatter graphs:
- A column containing an index n representing the number of users e.g. from 1 to 50, i.e. up to the Expected Network Size N= 50.
- A column containing the individual's reservation value v, i.e. a demand function for each person, uniformly distributed over the interval [0, 1]
- A column containing value of a network of expected size N to the nth user; also the point at which actual network size is also n. The price or willingness of the nth user to pay i.e. Vn = v*(n-1)*N
- A column containing the actual value of the network at size n, i.e. VT = n*Vn, where Vn = v*(n-1)*N
Your models should look something like this:
 |
| Demand/supply curve with uniformly distributed demand (N=43) |
b) For the same interval N graph the demand/supply curve for a demand function representing the classic 'three types of customer' model i.e. where v3types: [1.0, 0.5, 0.02]; in the following ratios: Spend Thrifts 10% (v3types = 1.0), Average Spenders 60% (v3types = 0.5), Tight Wads 30% (v3types =.02).
- Add a column containing value of a network of expected size N to the nth user; also the point at which actual network size is also n. The price or willingness of the nth user to pay i.e. Vn3types = v3types*(n-1)*N
- Add column containing the actual value of the network at size n, i.e. VT3types = n* Vn3types, where Vn3types = v3types*(n-1)*N
A graph of 'three types of customer' model only:
 |
| Network value for 'three types of customer' model |
Or combining both uniform distributed demand and the classic 'three types of customer' model:
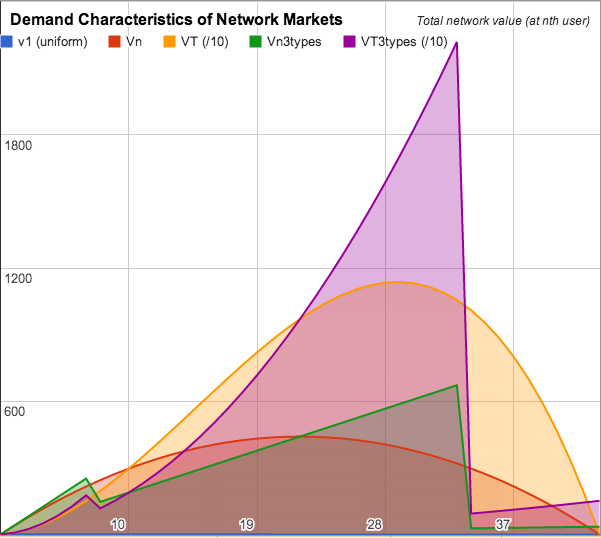 |
| Graph of network value overlaying uniformly distributed demand and 'three types of customer' model |